Central Pacific Region
The central Pacific weather region runs from the western parts of the San Jose and Puntarenas provinces, extending south from the Tarcoles River to the mouth of the Baru River, which is just north of Dominical. This region also includes Puntarenas town, Jaco, Quepos, Manuel Antonio and Parrita.
See Also
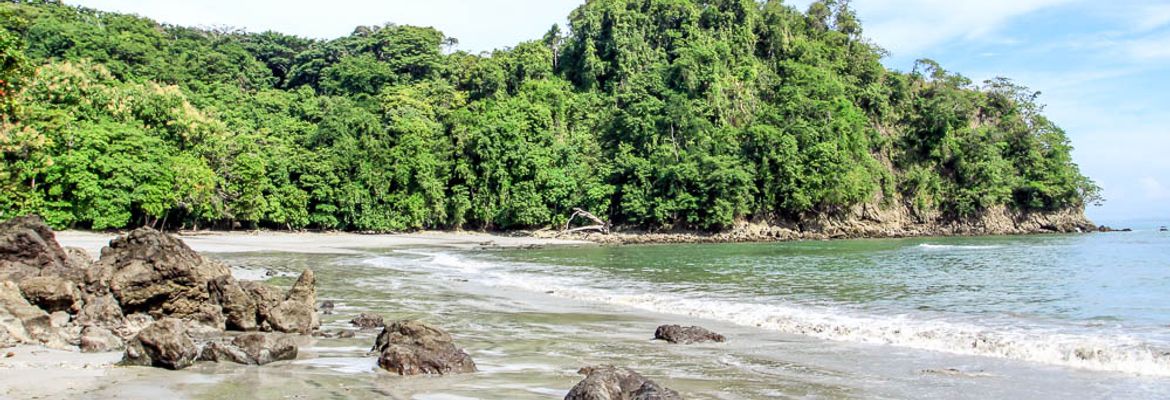
Manuel Antonio National Park
The canopies of Costa Rica's most visited national park wriggle with playful capuchin monkeys leaping between trees and scurrying down branches. Momma monkeys lag behind carrying newborns on their backs while off in ...
ContinueLast updated: Oct 28, 2023

Puntarenas
Brilliant sunsets, fresh seafood, charming architecture, and an oceanfront boardwalk typify Puntarenas, a small city on the Pacific coast. A recent ma....

Playa Hermosa - Puntarenas
Epic waves are Playa Hermosa’s main attraction; here, surfers can indulge in one of the biggest beach breaks on the country’s Pacific coast. Gorgeous ....

Jaco
Jaco's dark chocolate sands, lively surf and sunshine fill the days, but it's the bars, restaurants and nightclubs that keep the candle burning long a....

Manuel Antonio
Lush coastal rainforest trees arch over the ivory sands and blue opal waters of Manuel Antonio's coast. Their branches quiver and their leaves shuffle....