North Pacific Region
The north Pacific weather region includes some of Costa Rica's most popular tourist destinations and the country's driest weather in a province known as Guanacaste. Among the province's prominent towns are Playa del Coco, Playa Flamingo, Tamarindo, Nosara, Samara, Liberia and Tilaran. The north Pacific weather region also encompasses Orotina and San Mateo from the Alajuela province and the northern part of the Puntarenas province from the river mouth of the Tarcoles River. The average annual temperature in this weather region is 82 degrees, with April being the warmest month when temperatures can reach 100 degrees. The rest of the year, daytime temperatures average 91 degrees. The coolest nights are found between November and March, going down to an average of 66 degrees.
Last updated: Oct 28, 2023

Tamarindo
Tamarindo lives by the motto, "<strong>Surf</strong>, <strong>eat</strong> & <strong>party</strong>." This beach town lies at the heart of the....

Samara
Imagine a tropical beach with white sands, brilliant blue waves, and a very tranquil ambiance. This is Playa Samara. What began as a favorite getaway ....

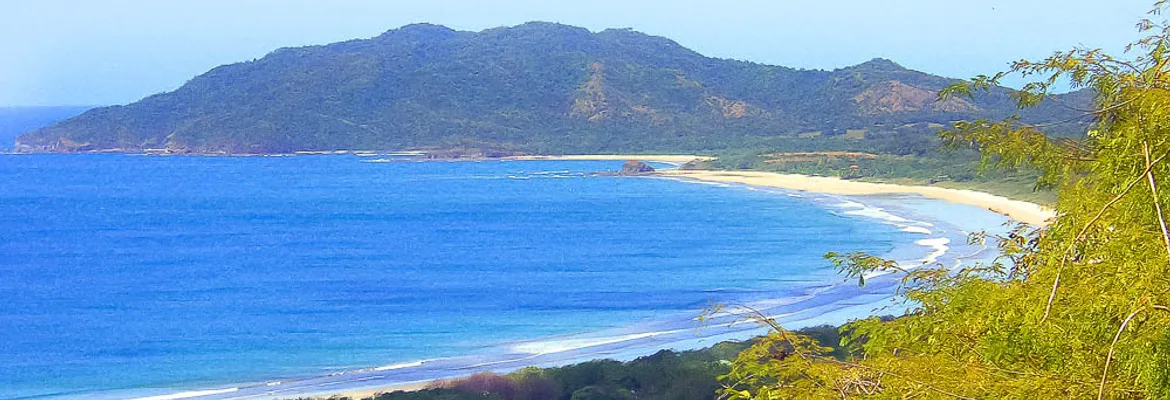
Playa Junquillal
Located just south of the Gold Coast, Playa Junquillal is a mile-long stretch of isolated Pacific coastline. The closest town, Paraiso, sits two miles....

Playa del Coco
Playa del Coco, or Coco Beach, is one of the most accessible and popular beach areas in Guanacaste. The mile-long stretch of beautiful, gray sand is l....

Playa Hermosa
Guanacaste’s beautiful Playa Hermosa, not to be confused with its neighbor of the same name near Jaco to the south, is known for its mile-long cradle ....