South Pacific Region
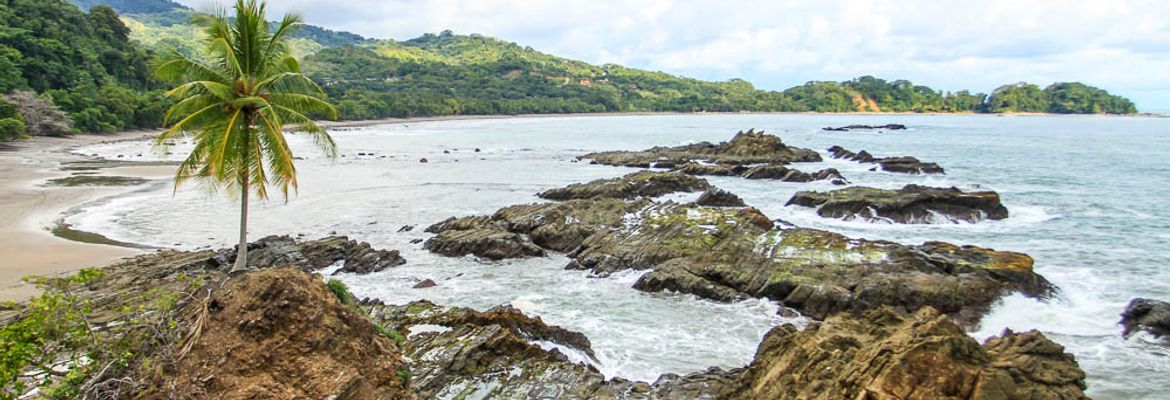
The south Pacific weather region, which includes the Osa Peninsula, the south Pacific coast from Dominical to Sierpe and the highest concentration of biodiversity in the entire country, has a shorter dry season and experiences more intense afternoon storms than its counterpart, the north Pacific.
See Also
North Pacific Region
The north Pacific weather region includes some of Costa Rica's most popular tourist destinations and the country's driest weather in a province known as Guanacaste. Among the province's prominent towns are Playa del ...
ContinueNorthern Weather Region
The northern weather region spans from the north of Alajuela through the cloud forests of Monteverde, past Ciudad Quesada and Lake Arenal to the Nicaraguan border.
ContinueLast updated: Oct 28, 2023

Sierpe
Hedged by more than 66,850 acres of protected, undisturbed mangroves that are intertwined with river canals and tropical rainforest on the edge of the....

Puerto Jimenez
The colorful town of Puerto Jimenez is located on the Osa Peninsula’s southeastern coast, adjacent to the rich waters of the Golfo Dulce. Backpackers,....

Pavones
The tranquil town of Pavones sits on the Golfo Dulce, located on Costa Rica’s south Pacific coast. Known as having one of the longest left point break....

Osa Peninsula
The Osa Peninsula makes up much of the southern Pacific coastline of Costa Rica. Here, lowland rainforests merge with mountainous terrain and isolated....

Dominical
When you're in Dominical the world outside is adrift in the ethers, somewhere beyond the rhythmic waves lapping against the shore of smooth cobbles an....